Review: Prices resisted near Fib 1.618. Looks likely to range below the cloud for the coming quarter. Fib 1.00 and Fib 2.618 support and resistance levels to look out for.
Plan: Hold

Review: RSI showing the beginnings of divergence. Likely to see a build up towards a small reversal. Unlikely to clear the cloud though, with prices trending below max full blown downtrend Fib 4.236. Best case in coming quarters, a return to Fib 3.618 (7.xx)
Plan: Trim if return to 7.xx

CLCT REIT
Review: Chart looks prime for a short term bounce. Unlikely to break the brown kijun. Eventually possible to cycle towards Fib 4.236, back at GFC levels, if there is a global crash.
Plan: Sell if prices return near brown kijun.

HST ETF
Review: Prices have dipped and found short term support near Fib 2.618. Support and Resistance levels to look out for near Fib 1.618 and Fib 2.618
Plan: Trim if prices return near Fib 1.618

MLT REIT
Review: No change from before, prices still ranging between Fib 1.618 and Fib 2.618
Plan: Trim if near Fib 1.00, Add if near Fib 2.618

Keppel
Review: Theoretically I should get out soon with prices trading above max Fib 4.236. But in a re-rating, anything goes. And there's still room towards the top of the price channel, much more if it forms a new upper channel.
Plan: Hold, till at least in the 8.xx zone

SATS
Review: Still ranging near the Fib 2.618 support level. Support and Resistance levels to look out for near Fib 1.618 and Fib 2.618
Plan: Add near Fib 2.618, Trim near Fib 1.618

ABC
Review: Prices still ranging within the channel.
Plan: Hold till nearer 4.xx

China Mobile
Review: Prices still resisted near Fib 1.00. A break upwards sees potential at the trend line intersection near 90.xx
Plan: Hold till nearer 90.xx

Lion Phillip REIT ETF
Review: Prices likely to range between Fib 1.618 and Fib 2.618 for the coming quarters. I don't think REITs in general will escape from this structural shift unscathed. Might be a good opportunity to trade the range.
Plan: Trim near Fib 1.618, Add near Fib 2.618

ST Engineering
Review: To not overcomplicate things, orange line = crisis level support / purple line = normal retracement support.
Plan: Hold long long, Add during purple and orange levels

Nikko AM REIT ETF
Review: Same as Lion Phillip REIT ETF, I think prices likely to range between recent lows and further upside resistance levels of 10%-15%.
Plan: Trim near Fib 4.236

Thaibev
Review: Previous uptrend Fib 1.618 might be a support level to look out for. Very high volume in recent candles with little price movement. We might be seeing a short term support forming soon.
Plan: Hold

FLCT REIT
Review: Same as other REITs, looks like a range moment. Watch if a breakdown happens though. Because the lower Fib supports are some way off.
Plan: Hold

Singtel
Review: prices still ranging within the zone. Purple lines are support and resistance levels to look out for.
Plan: Hold

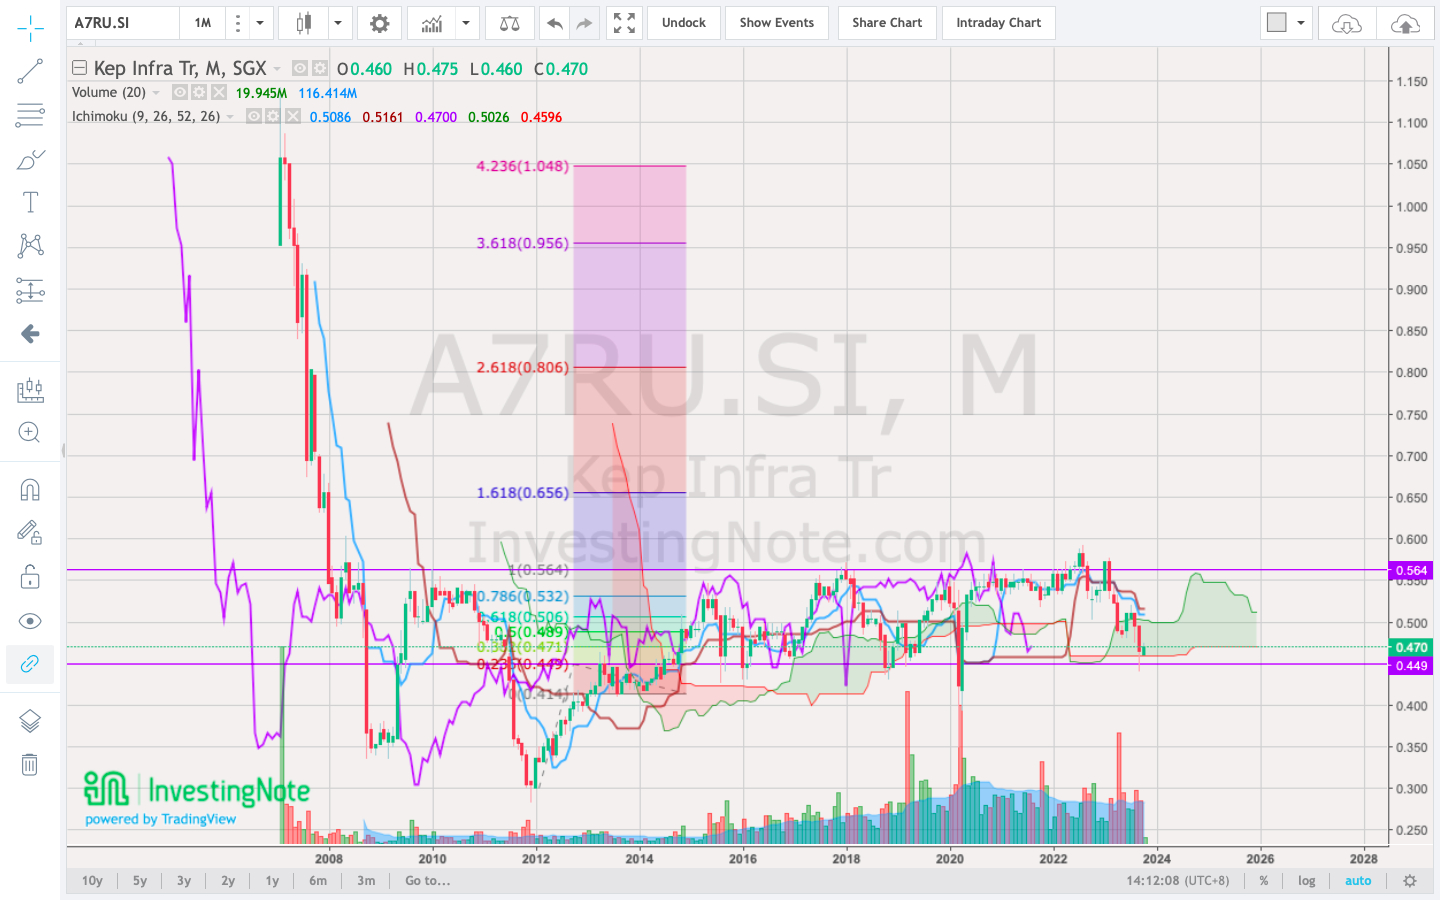
Kep Infra Tr
Review: Another likely ranging stock between the purple lines
Plan: Hold

Delfi
Review: With FA turning sour fast, I would presume the worst for TA. Fib 0.236 or Fib 0 to look out for support levels.
Plan: Hold
~
As always, gentle reminder to dyodd.